From September 28 to 29, three observability engineers from Puzzle visited the PromCon in Berlin. If you don’t want to read the entire blogpost, you can watch the 16 hours of livestream here. However, we will do our best to provide you with a TL;DW (Too Long; Didn’t Watch) summary.

What’s new
Native histogram
Histograms are one of the four metric types in Prometheus and are generally used to measure distributions such as request latency or response size. When creating a new traditional histogram, a user defines a number of bucket boundaries that will then be used to collect the different observations. A histogram with the default bucket boundaries might look as follows:
request_latency_seconds_bucket{le="0.005"} 0.0
request_latency_seconds_bucket{le="0.01"} 0.0
request_latency_seconds_bucket{le="0.025"} 0.0
request_latency_seconds_bucket{le="0.05"} 0.0
request_latency_seconds_bucket{le="0.075"} 0.0
request_latency_seconds_bucket{le="0.1"} 0.0
request_latency_seconds_bucket{le="0.25"} 0.0
request_latency_seconds_bucket{le="0.5"} 0.0
request_latency_seconds_bucket{le="0.75"} 0.0
request_latency_seconds_bucket{le="1.0"} 0.0
request_latency_seconds_bucket{le="2.5"} 0.0
request_latency_seconds_bucket{le="5.0"} 13.0
request_latency_seconds_bucket{le="7.5"} 13.0
request_latency_seconds_bucket{le="10.0"} 13.0
request_latency_seconds_count 13.0
request_latency_seconds_sum 61.100000000000016
As you can see, we track requests taking 5ms or lower and then gradually increase our buckets up to a latency of 10 seconds and beyond. Even without the introduction of additional labels, we’ve already generated 16 distinct timeseries. Adding labels such as the method, route or status_code will drastically increase the number of timeseries. This has the potential to create cardinality problems in Prometheus, which, in turn, can result in poor performance.
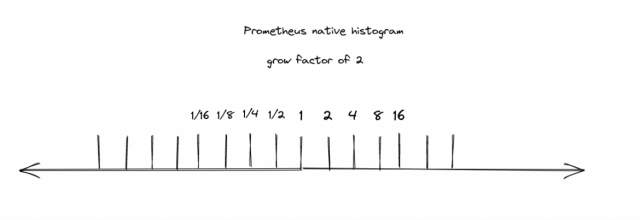
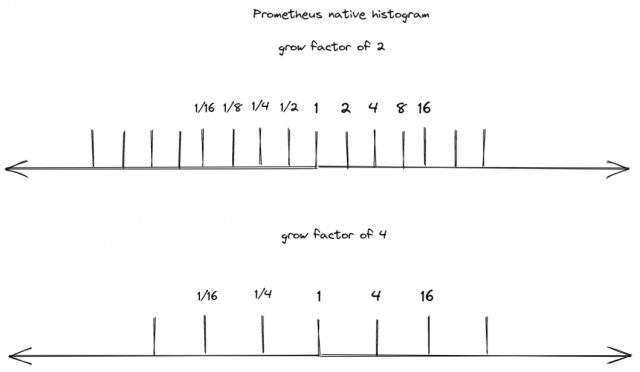
Native histograms try to address this issue by creating a brand-new data structure to store histograms efficiently in the Prometheus TSDB. Unlike traditional histograms, native histograms do not have a fixed predefined number of bucket boundaries, but instead use a growth factor to dynamically create buckets. For example, with a growth factor of 2, our initial bucket is set at 1, the next at 2, and subsequently, 4, and so forth. The same principle applies to numbers smaller than 1 with the next smaller number being 0.5 followed by 0.25 and so on.
The advantage of having these predefined bucket boundaries is, that we can seamlessly merge/aggregate histograms with different growth factors. For instance, when we calculate the sum of two native histograms with different growth factors (and consequently different bucket boundaries), Prometheus will first standardize the resolutions. This is achieved by converting the higher-resolution histogram to match the resolution of the lower-resolution histogram. This is possible because we have corresponding bucket boundaries in both histograms, and Prometheus can simply sum up two adjacent buckets to lower the resolution:
Currently, native histograms are still experimental. If you would like to use them, you first have to enable native histogram support in Prometheus by setting the corresponding feature flag (--enable-feature=native-histograms). Additionally, the Prometheus client library used by your application or exporter needs to support native histograms as well. As of today, only the client libraries for go and java offer support for native histograms.
keep_firing_for
This new Prometheus configuration option allows you to keep an alert firing for a certain amount of time after the condition that triggered it has cleared. This is especially useful to avoid flapping alerts.
Usage:
groups:
  - name: system
    rules:
      - alert: InstanceDown
        expr: "up == 0"
        keep_firing_for: 5m
        for: 2m
        labels:
          runbook: https://example.org/alerts/up.md
        annotations:
          description: "{{ $labels.instance }} of job {{ $labels.job }} has been down for more than 5 minutes."
          summary: "Instance {{ $labels.instance }} down"
scrape_config_files
You now have the option to split up your scrape configuration into separate files. This will help you in organizing and managing your various scrape configurations and will contribute to a tidier Prometheus configuration.
Usage:
global:
  scrape_interval: 15s
  evaluation_interval: 15s
alerting:
  alertmanagers:
    - static_configs:
        - targets:
          - localhost:9093
rule_files:
  - "rules.yml"
scrape_config_files:
  - /etc/prometheus/scrape_configs/*.yaml
OpenTelemetry
„OpenTelemetry“ was, besides „Native Histogram“, one of the biggest buzzwords at PromCon 2023. So what is OTel (short for OpenTelemetry). and do you need it?
What is OTel
OpenTelemetry is a vendor-neutral open-source Observability framework for instrumenting, generating, collecting, and exporting telemetry data, such as traces, metrics, logs. As an industry-standard, it is supported by over 40 observability vendors, and has been integrated into numerous libraries, services, and apps. It has also been adopted by a significant number of end-users.
https://opentelemetry.io/docs/
This Framework contains a specification for its components, a standard protocol, semantic conventions that define a naming scheme, APIs that define how to generate telemetry data, a pretty extensive library ecosystem that implements instrumentation for common libraries and frameworks, Language SDKs, the OpenTelemetry Collector a proxy that receives, processes and exports telemetry data and various other tools.
Why OTel
OTel is the merger of OpenTracing and OpenCensus, two projects that tried to solve the lack of a standard on how to instrument code and send telemetry data to an observability backend. In order to make your code observable, it needs to emit traces, metrics and logs. OTel helps you by allowing you to own the data you generate, rather than being stuck with a proprietary data format while also providing a single set of APIs and conventions.
What OTel isn’t
OTel isn’t a replacement for Jaeger, Prometheus or any other observability back-ends you already have in place. OTel isn’t a storage nor a visualization tool but is focused on the generation, collection, management and export of telemetry data.
OTel Collector
The OTel Collector is probably the easiest way to get started with OTel, offering a vendor-agnostic implementation on how to receive, process, and export telemetry data.
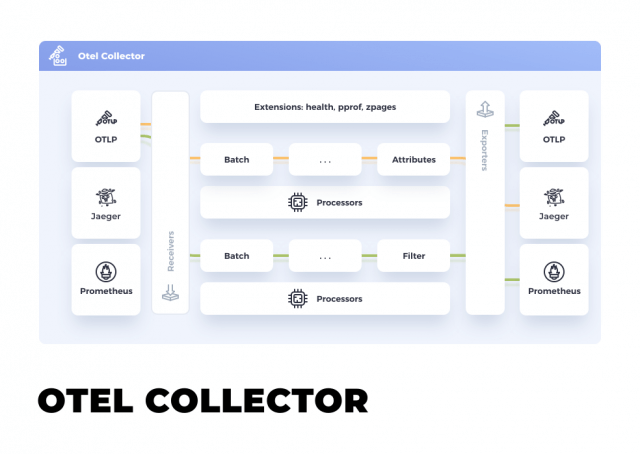
The OTel Collector can also be used to translate Metrics from one format to another, so if you have an instrumented app with statsd you could just put the OTel Collector between it and Prometheus (but you probably already have a stasd-exporter in place).
What are we gonna do about OTel
For us at Puzzle ITC, OTel sounds like a very interesting and future-proof standard for observability. As we just started instrumenting our own apps, we probably are going to try to use OTel for that, and you will probably soon be able to read about that in a future blogpost here.
Java client
PromCon 2023 also saw the 1.0 release of the Prometheus Java client. This new release marks a significant rewrite of the client while also making use of all the new features that Prometheus itself gained in the last years.
Notable features include the support for native histograms from a client perspective and the inclusion of an OpenTelemetry exporter.
In addition to all the technical improvements, the project also expanded the extensive documentation and added performance benchmarks.
Native histograms
As seen in the previous section, native histograms are a new addition to Prometheus.
Using the following code, you can add a histogram tracking the request latency of a web application:
Histogram histogram = Histogram.builder()
   	.name("request_latency_seconds")
   	.help("latency of web requests")
   	.unit(Unit.SECONDS)
   	.labelNames("path", "status")
   	.register();
This will create a histogram in the classical (old) format and the new native format. Which of those is ingested depends on the configuration of your Prometheus server. For classic histograms the bucket boundaries will be:
.005, .01, .025, .05, .1, .25, .5, 1, 2.5, 5, and 10
Migrating from older releases
Due to the significant rewrite of the library, the 1.0 release is not backwards compatible with the older 0.16 release. However, this does not mean that a complete overhaul of the instrumentation code is necessary. The Prometheus Java client provides a bridge for the switch from the previous simpleclient to the new PrometheusRegistry.
Adding the following Maven dependency:
<dependency>
    <groupId>io.prometheus</groupId>
    <artifactId>prometheus-metrics-simpleclient-bridge</artifactId>
    <version>1.0.0</version>
</dependency>
and adding the following line to your code will ensure compatibility with the new 1.0 client.
SimpleclientCollector.builder().register();
If you do want to refactor your code or need a more detailed explanation of the required steps, check out their documentation.
Honorable mentions
Compared to 0.16 many more configuration options are now available as runtime configs that can be specified using a properties file or as system properties. This means that many settings can be configured or adjusted without modifying the application code.
The Prometheus Java Client makes sure that updates to counters and histogram metrics can happen in parallel and your multi-threaded application is not bogged down by synchronized metrics updates.
Perses
Augustin Husson and Antoine Thebaud, both employed by Amadeus presented a new tool called perses. Perses is a vendor-agnostic toolkit designed to create visualizations and dashboards. It aims to fulfil a similar role as Grafana but unlike Grafana, perses will be vendor neutral and licensed under Apache 2.0.
Perses focuses heavily on GitOps compatibility and tries to simplify the process of provisioning dashboards and datasources as code. It is not limited to be used as a standalone application; instead it also aims to provide different npm packages that can be incorporated into any application displaying Prometheus data. This project is still under heavy development with new versions released every couple of weeks. As of today, you can use perses to create Dashboards with Time series charts, gauge panels, stat panels and markdown panels. There is even a migration script available which converts Grafana dashboards to perses dashbaords. However, due to the limited number of visualization types available in perses, this will not work for every dashboard, but it is certainly a good start. Ongoing development mainly focuses on native Kubernetes support, providing CRDs for resources such as dashboards and data sources.
Looking ahead, Amadeus intends to hand over the project to the Cloud Native Computing Foundation aiming to make it the leading dashboarding tool in the cloud-native domain.
Outlook
Zero instrumentation metrics using eBPF (Grafana Beyla)
Grafana Labs Introduced Beyla at PromCon, an application which instruments your application with the help of eBPF. At the moment Beyla only delivers HTTP/HTTPS (since Java has its own SSL implementation only HTTP works) metrics, but they want to implement more. The idea behind Beyla is, if you need to instrument an application where you have no ability to instrument the code or even aren’t able to recompile the code or something like that, Beyla can help you by reading those metrics right from where the magic happens. One benefit of this method of instrumentation is that it also captures wait times in your kernel, which wouldn’t be apparent if you instrumented the code directly.